7 Rules of the

BREAKOUT STRATEGY

What is Breakout?

A Breakout is a Stock price moving outside a defined Support or Resistance level with increased volume. A Breakout Trader enters a Long position after the Stock price breaks above Resistance or enters a Short position after the Stock breaks below Support.

The price broke the Resistance Trendline with high volume.

Similarly, the price broke the Support Trendline with high volume, few recognize it as a Breakdown.

What is a False Breakout?

A False Breakout is also recognized as a ‘Failed Breakout’.

A Failed Breakout occurs when a price moves through an identified level of Support or Resistance but does not have enough momentum to maintain its direction. Since the validity of the Breakout is compromised, and the profit potential significantly decreases, many traders close their positions. A Failed Breakout is also commonly referred to as a False Breakout.

The price showed the characteristics of a Breakout. However, it failed in its attempt and broke on the opposite side.

There are 7 Rules to Identify a
Best Quality Breakout Trade

Rule no. 1

Trendline Should be Valid

For a Trendline to be valid, minimum 3 points or pivots should be connected. If only 2 points or pivots are connected in a Trendline then it will be considered as an Invalid Trendline as it does not provide enough data to accurately reflect the trend. The reason for this is that 2 points can only show a single trend direction, whereas 3 or more points can demonstrate a trend’s consistency and reliability.

The above image shows an Invalid Trendline

The above image shows a Valid Trendline

Rule no. 2

Breakout Should happen with Increase in Volume

A valid Breakout should happen with an increase in volume as compared to the previous candle’s volume. An increase in volume indicates a rise in interest from Buyers (or Sellers in Breakdown), confirming the significance of the Breakout.


Without an increase in volume, the breakout may not be a genuine representation of market sentiment and could be prone to reversal. In other words, a Breakout accompanied by an increase in volume indicates a high probability of sustained momentum in the direction of the breakout, while a breakout without a corresponding increase in volume may be a false signal, and traders should exercise caution when interpreting such signals.


Therefore, traders should pay close attention to the volume when identifying a breakout to determine whether it is valid and reliable.

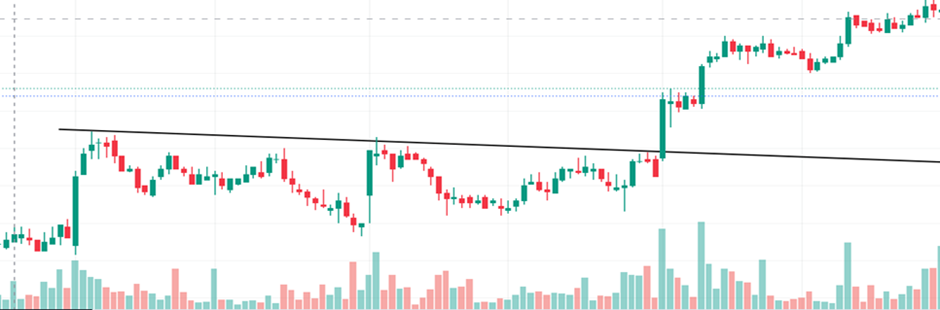
Above is an example of a valid Trendline Breakout with Increase in volume

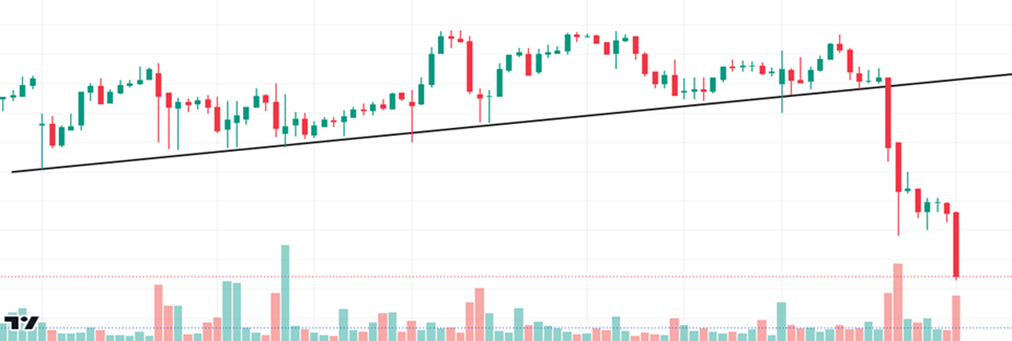
Above is an example of a valid Trendline Breakdown with Increase in volume

Rule no. 3

There Should not be an Opposite Reaction

There Should not be an Opposite Reaction in the Breakout/Breakdown candle. An opposite reaction to a breakout candle could signal that the breakout was not valid or was false, leading to incorrect trading decisions. Therefore, there should not be opposite reactions in a breakout/breakdown candle in a valid trendline.


An opposite reaction in a breakout candle indicates that there is a Selling pressure in the breakout candle (and an opposite reaction in a breakdown candle indicates that there is a Buying pressure in the breakdown candle).

Above image is an example of Opposite reaction in the Breakdown candle.

Rule no. 4

There Should not be any Opposing Institution Zone

There Should not be any Opposing Institution Zone in the Higher Time Frame near the breakout or breakdown of a valid Trendline. If a Breakout of a valid Trendline happens and there is an Institution Selling Zone in the Higher Time Frame near that then it can be an Institution Trap and that breakout may convert into a False Breakout. Same happens in Breakdown, if there is an Institution Buying Zone in the Higher Time Frame near that then it can be an Institution Trap and that breakdown may convert into a False Breakdown.

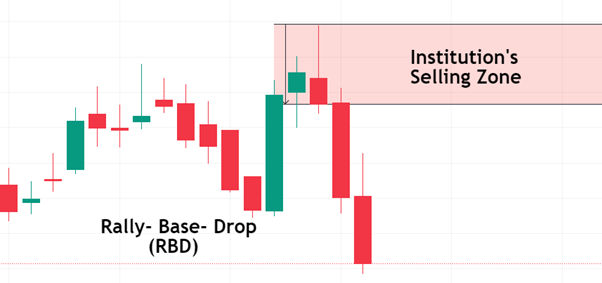
Above image is an example of a Breakout converted into a False Breakout because of Institution Selling Zone in the Higher Time Frame.

Rule no. 5

Entry Point will be Above the close of Breakout Candle

When a Breakout of a valid Trendline happens then we have to plan our Entry point just above the close of a Breakout candle. In case of Breakdown of a valid Trendline, Entry point will be just below the close of a Breakdown candle.

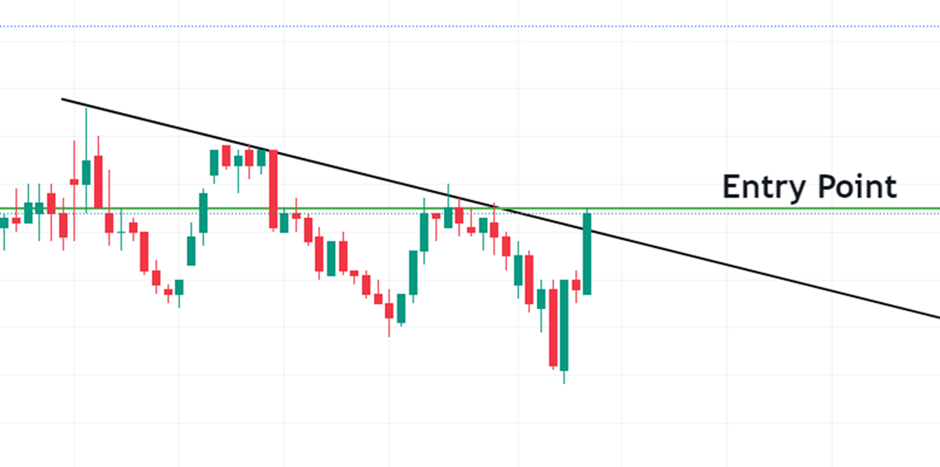
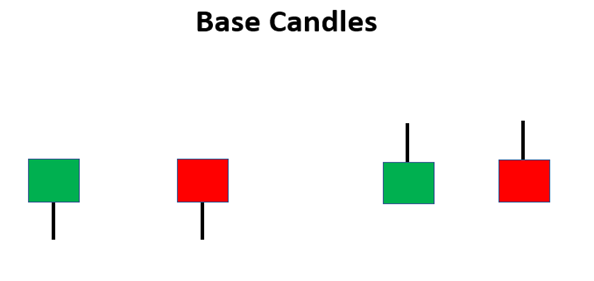
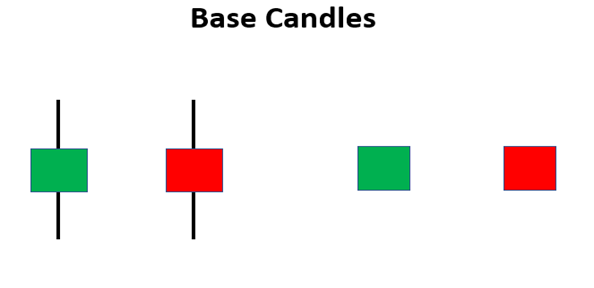
Above images are representing the Entry point in a Breakout and Breakdown candles.

Rule no. 6

Stop Loss Point will be below the Breakout Candle

When a Breakout of a valid Trendline happens then we have to plan our Stop Loss point just below the Breakout candle. In case of Breakdown of a valid Trendline, Stop Loss point will be just above the Breakdown candle.

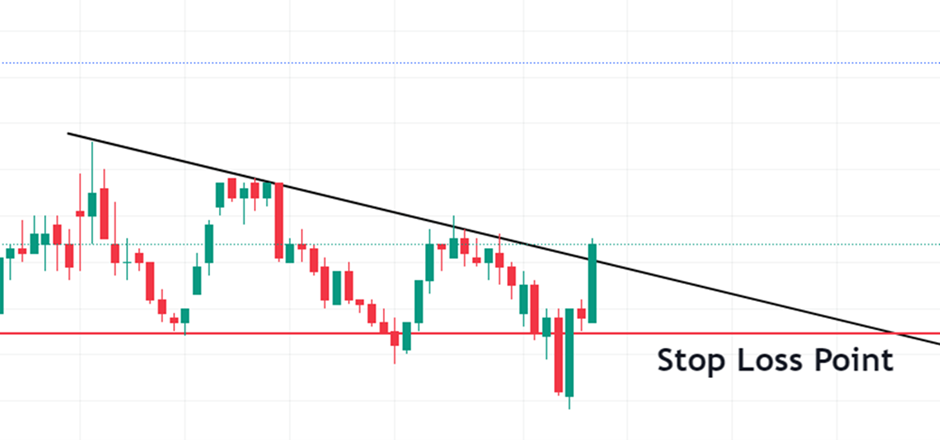
Above images are representing Stop Loss point in Breakout and Breakdown candles.

Rule no.7

Target Should be within Opposing Institution Zone

Whenever we plan a Breakout/Breakdown Trade, we have to plan a minimum RR (Reward to Risk Ratio) of 2:1. While planning a Breakout/Breakdown trade, if the RR till the Opposing Institution Zone in the Higher Time Frame (Institutions Buying Zone in Breakdown and Institutions Selling Zone in Breakout) is less than 2:1 then we will reject that trade as the price may react from the Opposing Institution Zone and may convert into false breakout/breakdown.


If we are not getting the desired RR, then we must reject that trade as it can affect our Risk Management and Money Management.

Here is an example of how to calculate
RR till Opposing Institution’s Zone

Who are these Institutions?

To understand that, First we have to understand who the Market Players are.

There are 2 types of Market Players: -

Big Players

Small Players

Big Players:-

Big Players are the Institutions (FII’s- Foreign Institutional Investors & DII’s- Domestic Institutional Investors) who invest in the Stock Market. They have Thousands of Crores of Capital to invest in the Stock Market.

A Foreign Institutional Investors (FII’s) is a group of investors who invests in a foreign country other than their home country. These investors may be hedge funds, charity trusts, pension funds, investment banks, mutual funds, insurance companies, or high-value debenture bonds.

FIIs are incorporated outside India and must register themselves with SEBI and adhere to the rules and regulations. Some examples of FIIs are Morgan Stanley, Bank of Singapore, Vanguard.

Domestic Institutional Investors (DII’s) are the high-value Indian companies that invest in the Indian stock market to earn profits. These businesses may include mutual funds, hedge funds, insurance companies, and more.

Small Players:-

Small players or traders or investors are the Retail Traders.

Small players generally have a capital of few Thousands to few Crores.

There are 2 types of Small players. One is Professional Traders and another are Novice Traders.

Professional Traders are the traders who earn consistently from the Market with a proper Strategy, mindset and a setup to trade.

And Novice Traders are the traders who do not earn consistently and they are on the losing side most of the time as they don’t have any proper setup to trade.

Who Exactly Earns from Any Market?

Trading in the Stock Market is a Zero-Sum game. Which means one person’s gain is another person’s loss.

Zero-Sum games in daily life include games like poker or chess where one person gains and another person loses, which results in a zero-net benefit for every player.

In the markets and financial instruments, futures contracts and options are Zero-Sum games as well.

So, the question comes to who exactly earns from the stock market?

It’s the Institutions and the Professional Traders who earn from the market.

And Novice traders end up on the losing side.

So, the total gain of the Institutions and the Professional Traders is the total loss of Novice Traders as the Stock Market is a Zero-Sum game.

Let’s understand how these
Institution’s zones are formed.

Supply & Demand Concept:

  • Price moves because of Supply and Demand imbalance
  • Demand: Price turns higher at price point where Demand exceeds Supply
  • Supply: Price turns lower at price point where Supply exceeds Demand

Institutional Supply & Demand Balance

   Price decline due to Institutional Selling which form a Institution’s Selling Zone (Supply Zone)

The above image shows that the Supply increased when the price came at the Institution’s Selling Zone because of which the price fell.

●   Price rally due to Institutional Buying which form a Institution’s Buying Zone (Demand Zone)

The above image shows that the Demand increased when the price came at the Institution’s Buying Zone because of which the price Rallied.

Components of the Zones

There are 2 components in a Zone:

Leg Candles

Base Candles

Let's understand these components in detail.

Leg Candles

●   These Candles are FOOTPRINTS of Institutional Buying or Selling

●   The Greatest imbalance between Supply and Demand is found at the origin of Leg Candles.

●   These are Expanded Range Candles, when compared to the other candles on the chart they are visibly much BIGGER in Size.

●   Ideally a Strong Leg Candle should be an Expanded Range Candle

●   The Green Leg Candle is called a Rally Candle and the Red Leg Candle is called a Drop Candle

Base Candles

  • These Candles Indicates that Supply and Demand is Balanced
  • These Candles Indicate that Orders are Potentially being accumulated by the institutions.
  • Ideally it should be Narrow in Range
  • Base Candles can be of any colour (Red or Green)

Institution’s Buying Zone Formation

There are 2 types of Institution’s Buying Zones:

➔ Continuation Pattern - RBR (Rally- Base- Rally)
➔ Reversal Pattern - DBR (Drop- Base-Rally)

The above images shows Continuation Pattern of Institution’s Buying Zone

The above images shows Reversal Pattern of Institution’s Buying Zone

Institution’s Selling Zone Formation

There are 2 types of Institution’s Selling Zones:

➔ Continuation Pattern - DBD (Drop- Base- Drop)
➔ Reversal Pattern - RBD (Rally- Base- Drop)

The above images show Continuation Pattern of the Institution’s Selling Zone

The above images shows Reversal Pattern of Institution’s Selling Zone

Hope you Liked the Book

For More Such Learnings, Contact us!

Quick Links:
About Us
Our Programs


This Website Is Not Affiliated To Facebook Or Google.